Navigating the featureOS Analytics Dashboard
The featureOS Analytics Dashboard helps you gain valuable insights into the performance and dynamics of your data. This guide will walk you through each section of the Analytics dashboard, helping you make the most out of it.
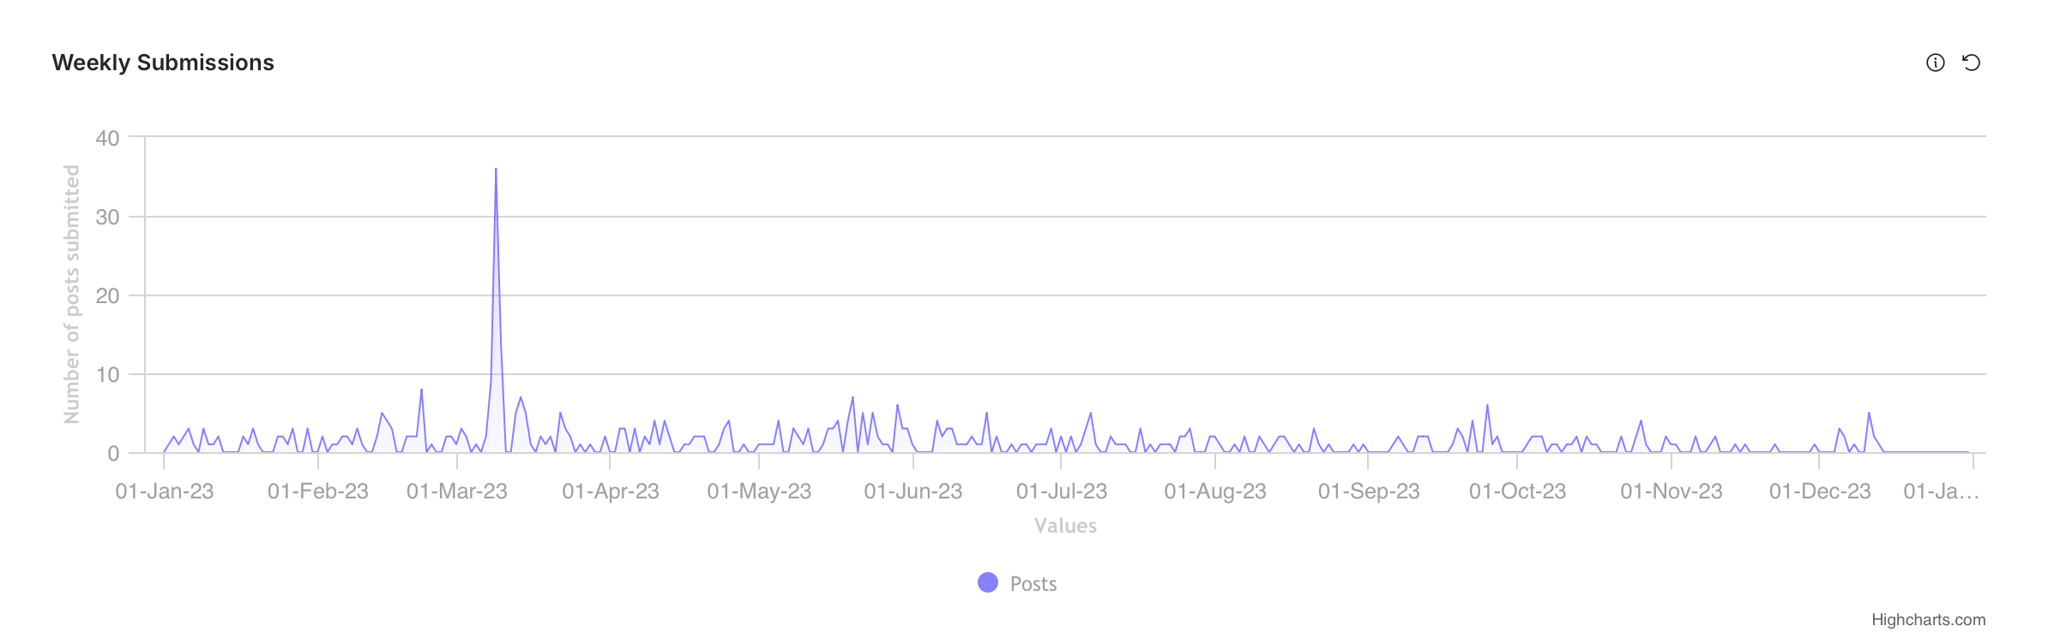
Weekly Submissions - Stay on top of your content flow by monitoring the number of posts submitted each day, allowing you to identify trends and patterns in your posting activity.
Top Performers - Recognize the efforts of your team members by exploring the Top Performers section. This area highlights individuals who have successfully completed the most assigned posts, providing a quick overview of productivity.
Post Status Distribution - Efficiently manage your workflow by understanding the distribution of posts across different statuses. The Post Status Distribution chart compares the number of posts in each status category, aiding in prioritization and task tracking.
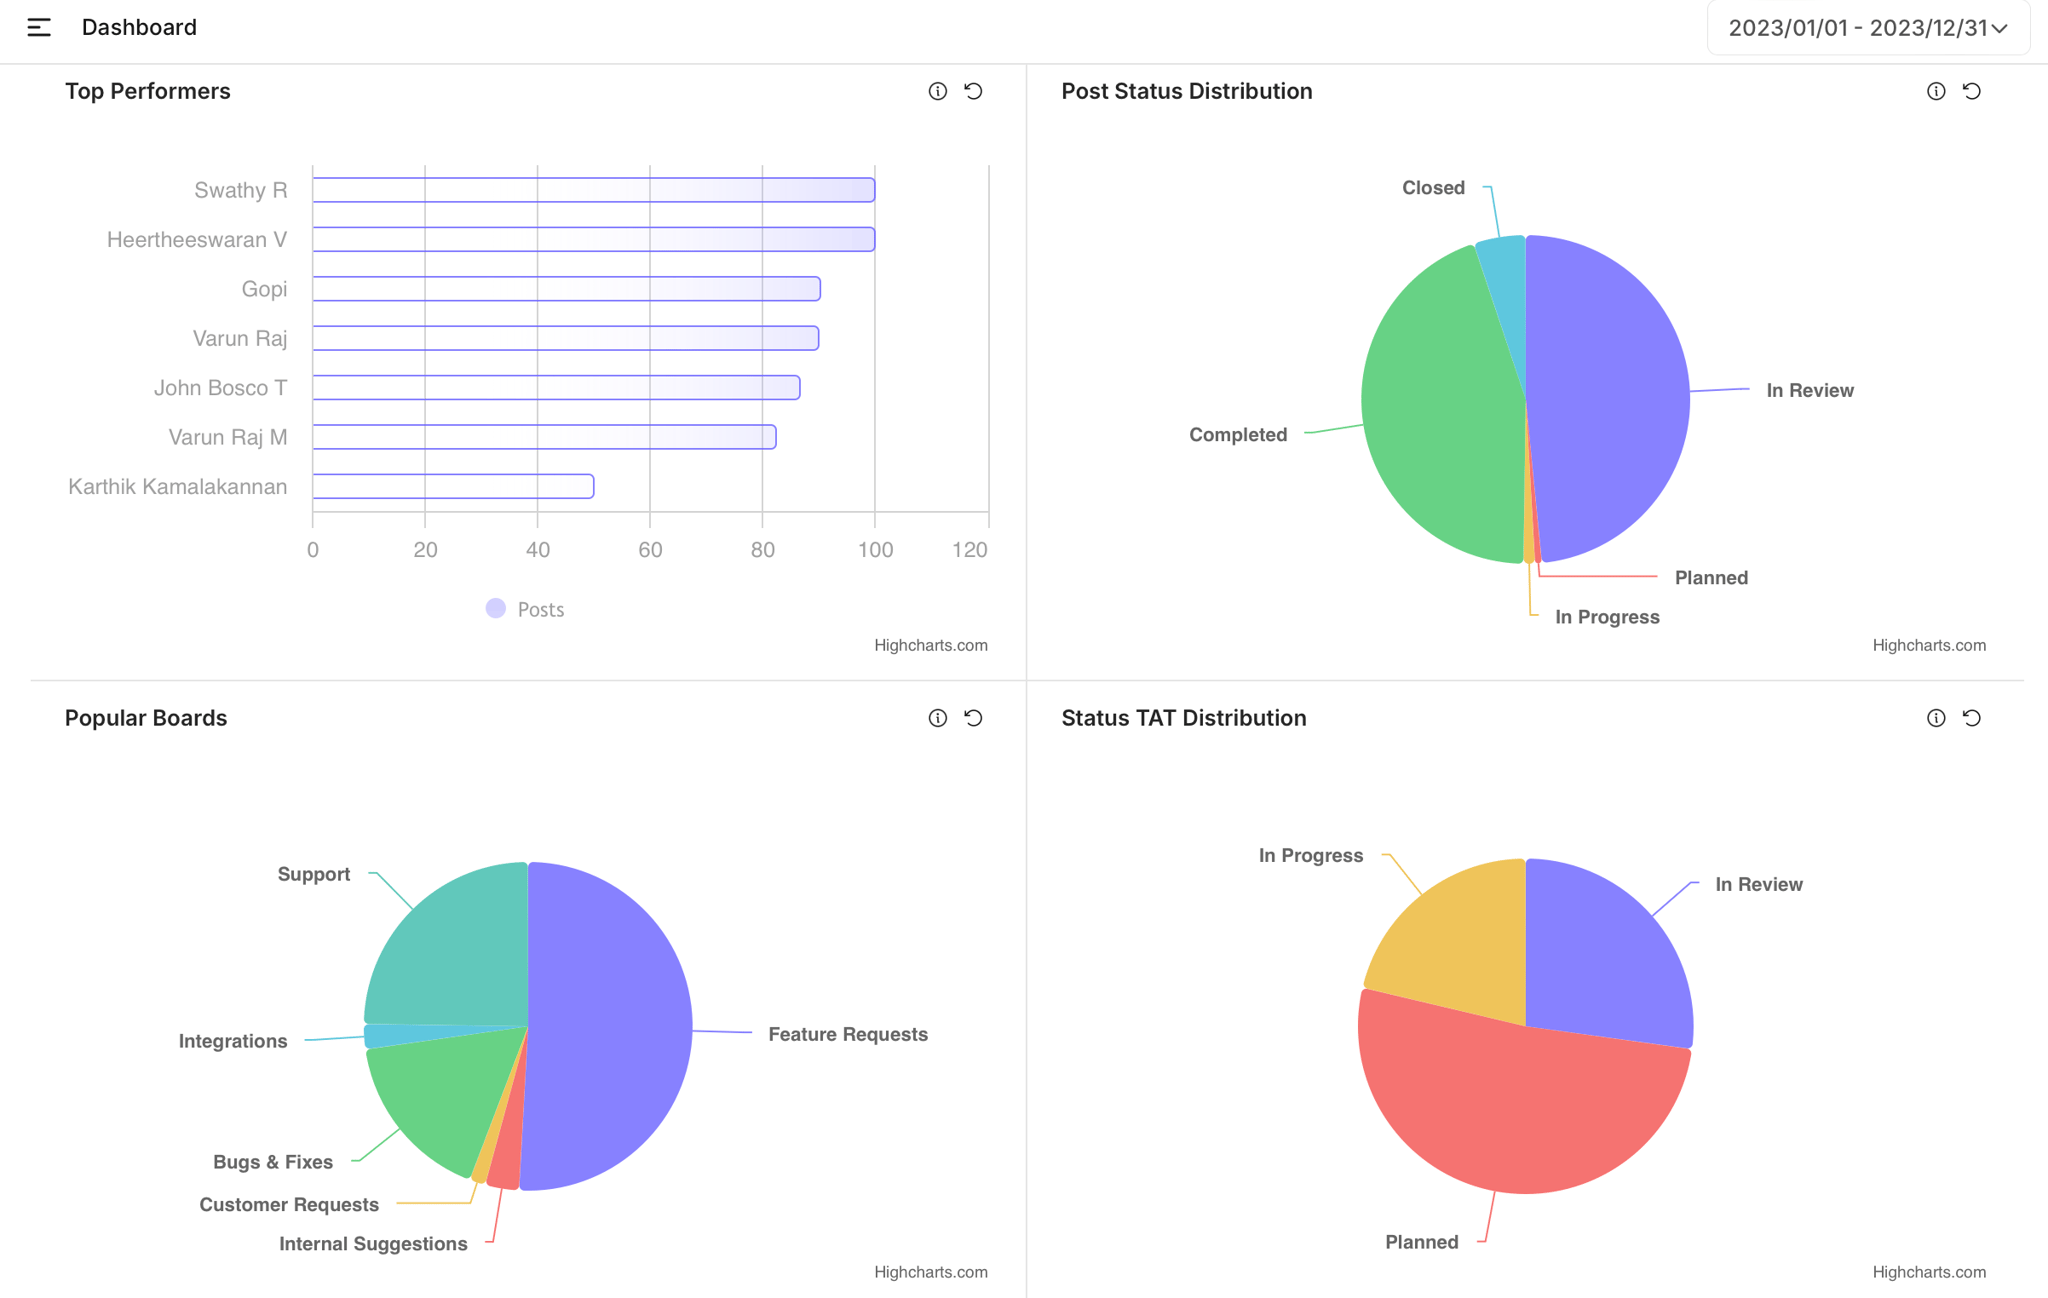
Popular Boards - Measures the number of posts on each board. This insight helps you allocate resources effectively and ensures that your team is focusing on the most active and relevant areas.
Status TAT Distribution - Get a detailed view of the turnaround time for different post statuses. This comparison allows you to assess and improve the efficiency of your workflow.
Assignee Distribution - Identify key contributors by reviewing the Assignee Distribution section. This displays individuals with the highest number of posts assigned to your team member, helping you recognize and appreciate their dedication.
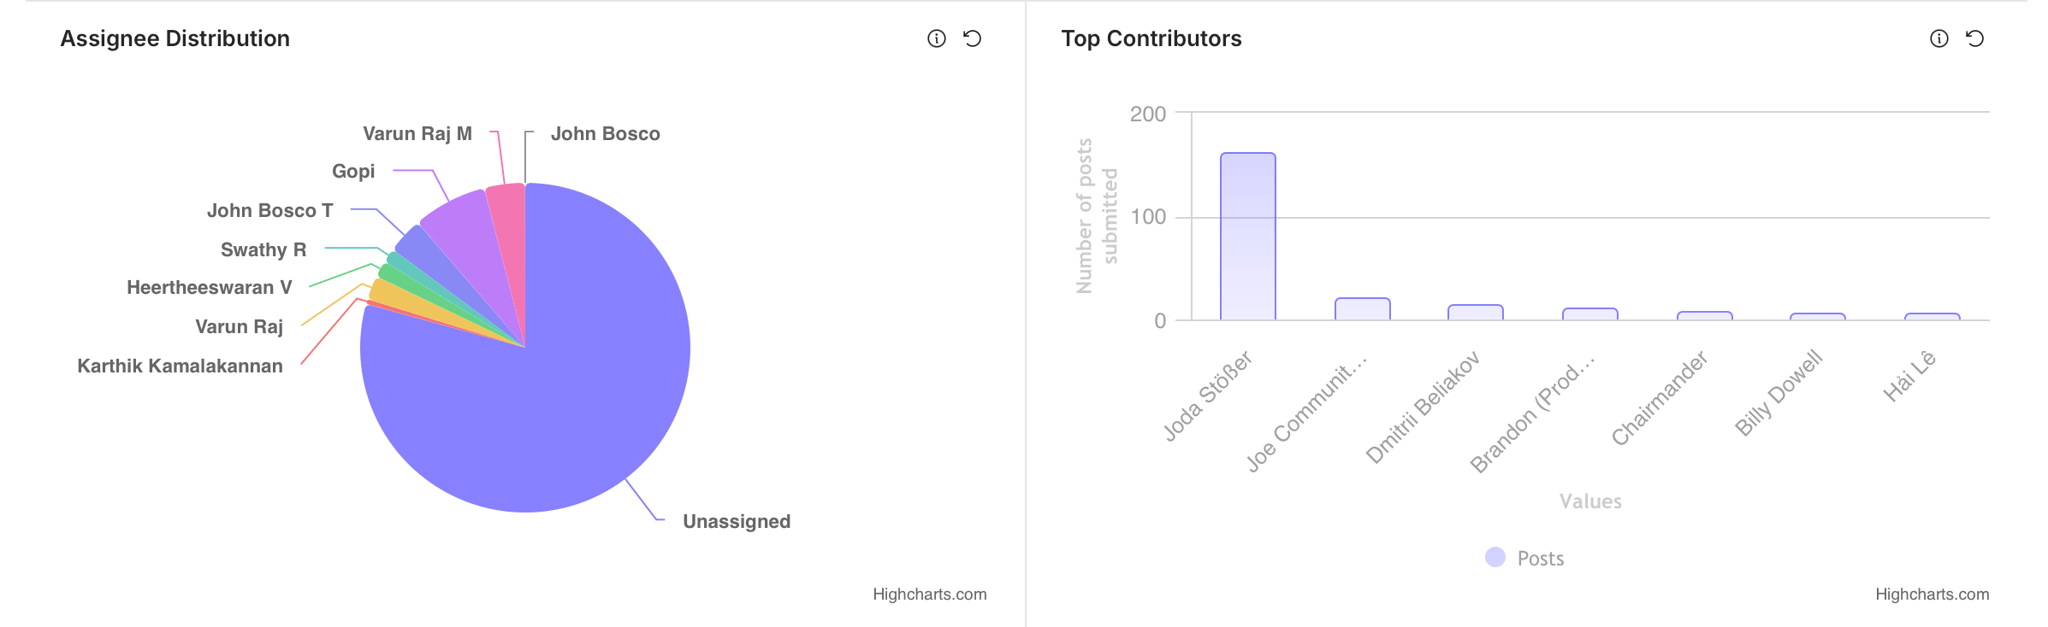
Top Contributors - This section highlights customers who have made significant contributions by interacting.
Post submitted
Comment added to a post
Adding Tags
Post title updated
Post description updated
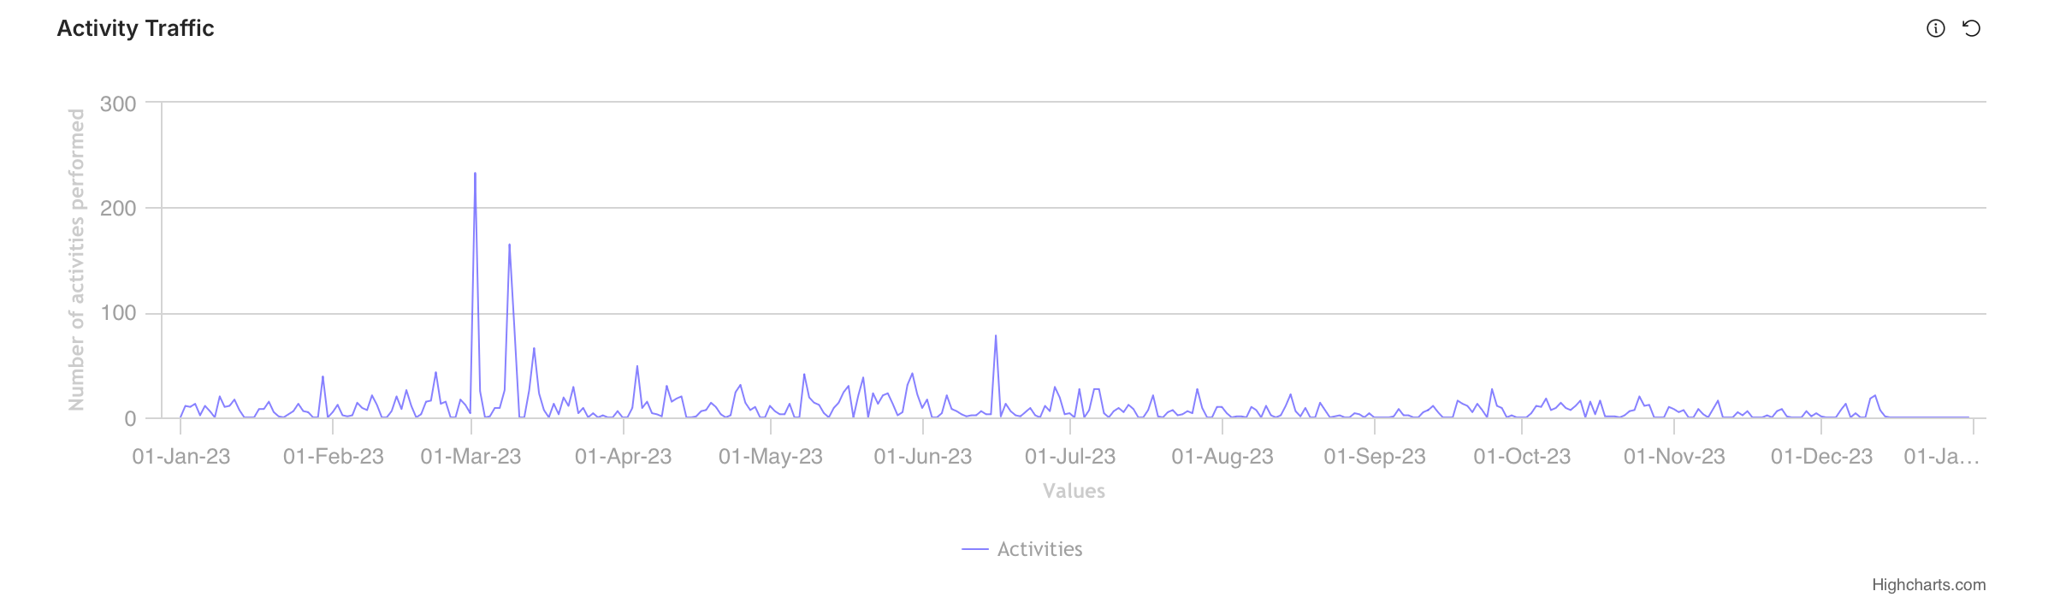
Activity Traffic - Monitor the pulse of your platform with the Activity Traffic section. This metric measures various activities such as,
Post submitted
Post Status updated
Post assigned to a team member
Comment added to a post
Internal comment added to a post
Post title updated
Post description updated
Post pinned/unpinned
Post approved/pending in moderation
Comments disabled/enabled in a post
Post moved to a different board
Tag added to/removed from a post
Post hidden/unhidden
ETC set for a post
Post merged/unmerged
Due Posts - This section highlights posts with an estimated time of completion (ETC) date set in the near future, ensuring that timely action is taken.
Stale Posts - Identify stagnant posts with the Stale Posts feature, which highlights posts with an ETC date set in the near future. This information helps in proactively addressing potential delays and maintaining a smooth workflow.
Top Voted Posts - This area showcases posts with the highest number of votes, providing insights into the posts that resonates most with your audience. (Completed & Closed posts are not included since they are inactive statuses).
Overdue Posts - This section flags posts that have not been completed by their set ETC date, allowing you to take corrective actions and meet deadlines effectively.
Plans & Pricing
Analytics dashboard is available as a Power-Up for Runway plan and is included in Take Flight and higher plans.
Need more help?
Reach out to our support at [email protected] or submit a request on our support board! 😃